Dwyer Instrument Particulate Monitors: Correlating picoAmp Readings to mass Concentration
Dwyer Instrument Particulate Monitors: Correlating picoAmp Readings to mass Concentration
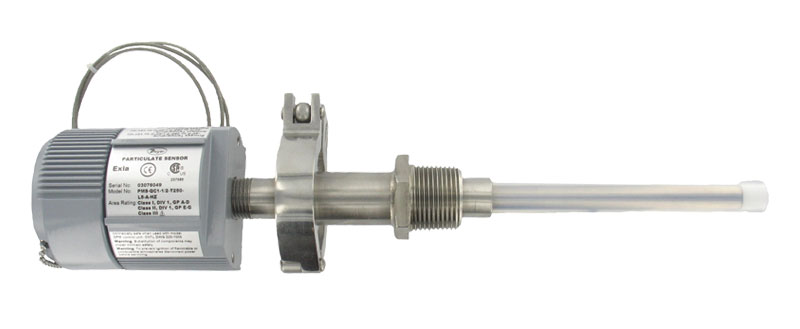
Dwyer Instruments Particulate Monitors are designed using the Induction (AC) method for measuring particulate matter as it passes the sensing probe. As particles pass by the probe, minute currents are induced relative to the amount of particulate in the air flow. This induced current is what is being measured by the device, and the subsequent scale range is in the units of picoAmps (pA). The signal is not significantly affected by velocity variations in fabric filter applications. This measurement method is a proven way of determining when leaks or holes develop in baghouse filters, however some regulatory agencies require that particulate is measured in concentration terms; i.e. mg/m3 . Since the mass concentration of particulate is a function of the specific material being measured, the best practice is to audit your installation and perform gravimetric tests to set the baseline correlation between the particulate monitor reading and the actual mass concentration of the process. The following is a brief review of the steps taken by one 3rd party entity to prove that a particulate monitor utilizing induction technology was capable of measuring concentrations below 1 mg/m3, that it could detect small leaks of increasing size, and that the induced current measured in pA is reasonable linear in correlation to actual mass. By following similar steps a mass concentration correlation can be determined when required, and the pA readings from the particulate monitor can be converted in mass concentration. Please review your local regulatory requirements for specific standards and test methods that are acceptable for your installation.
Independent Evaluation of Induction Particulate Monitor
Pulsejet Baghouse Application
1.0 Test Schedule
· Evaluation of basic operational behavior
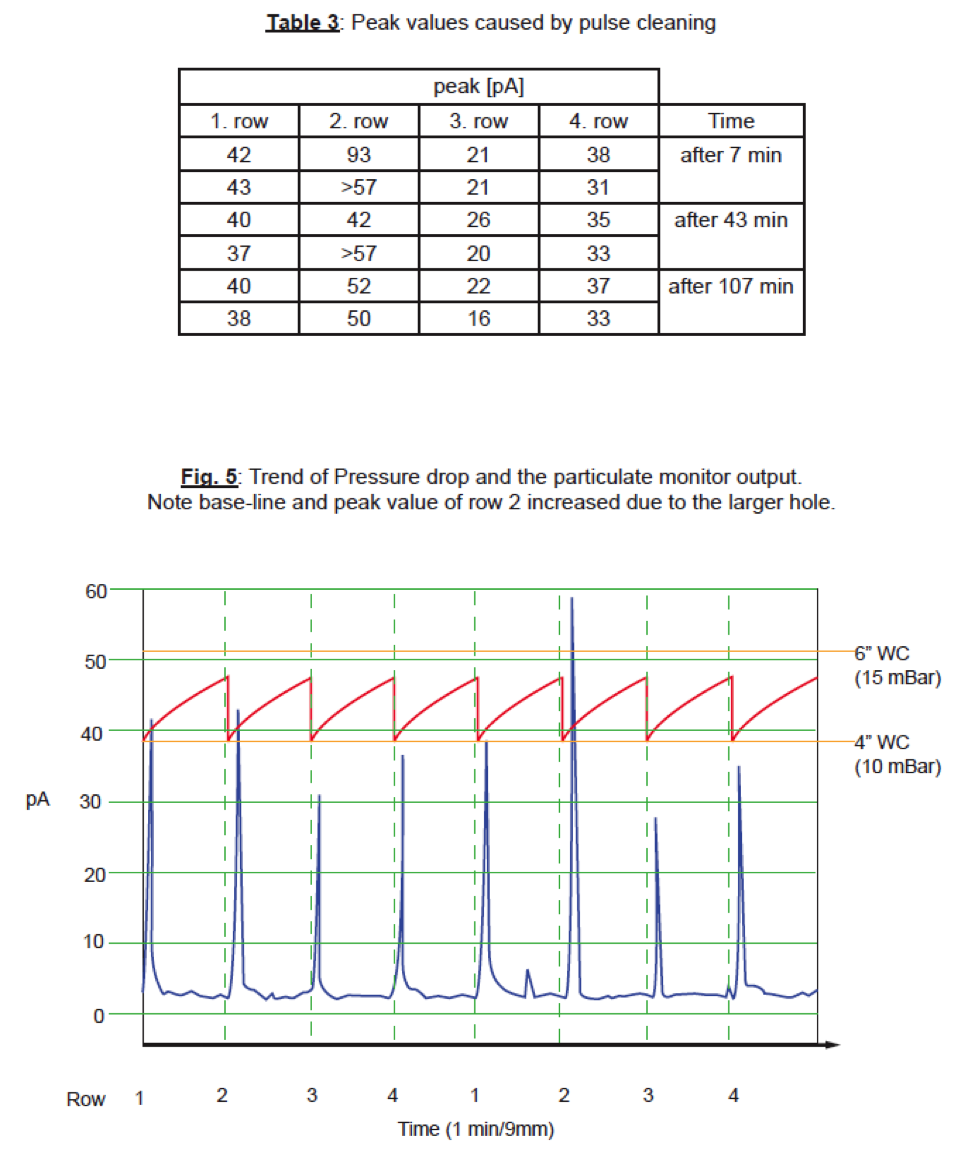
· Correlation between peak emission values and cleaning of row
· Determination of the base line response
· Evaluation of leak detection capability
· Correlation to particulate concentration
· Summary conclusions
2.0 Experimental Set-Up
Filter Configuration
Filter type: 40-3
Filter medium: PE 550
Cloth area: 1174 ft3 (33.25 m3)
Number of filter bags: 38
2.2 Particulate Feeding
Particulate was fed directly by air lock from filter hopper to the raw air duct.
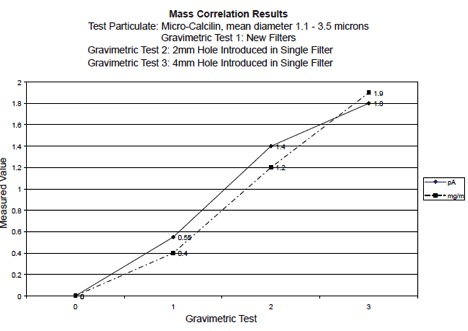
Test particulate was Micro-Calcilin with a mass mean diameter of x = 3.6 μm and x = 1.1 μm
2.3 Pulse Jet Cleaning
Controlled by differential pressure drop
Pulse pressure: 65 psi (4.5 bar)
Upper Δp-limit: 5.6” WC (14 mbar)
Lower Δp-limit: 5.4” WC (13.8 mbar)
2.4 Operating Conditions
Air to cloth ratio: 1.9 m3/min/m2
Raw a concentration: 125 g/m3
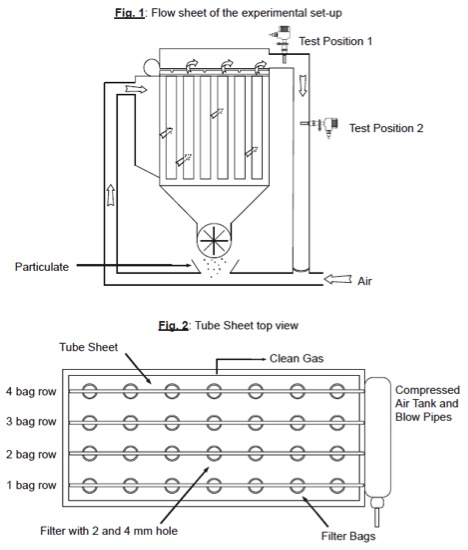
3.0 Response Time Test
Response time of monitor after pulsing row 4 (2m past clean air chamber, test position 1):
t = 0.15 s
v = 11 m/s
Response time of monitor after pulsing row 4 (9m past clean air chamber, test position 2):
t = 1.0 s
Response time of monitor after pulsing row 2 (9m past clean air chamber, test position 2):
t = 1.2 s
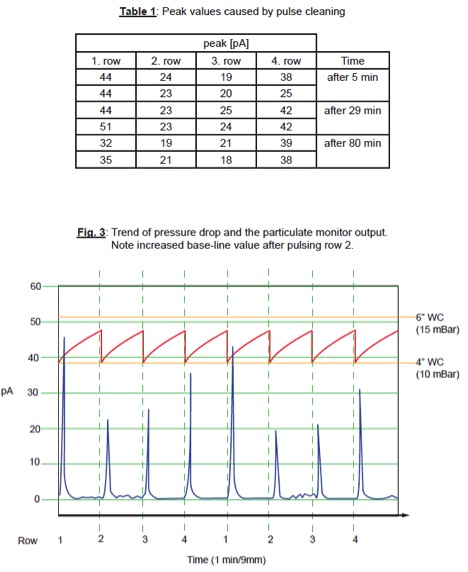
3.1 Baseline and Peak Tests
These tests were conducted with new filter bags.
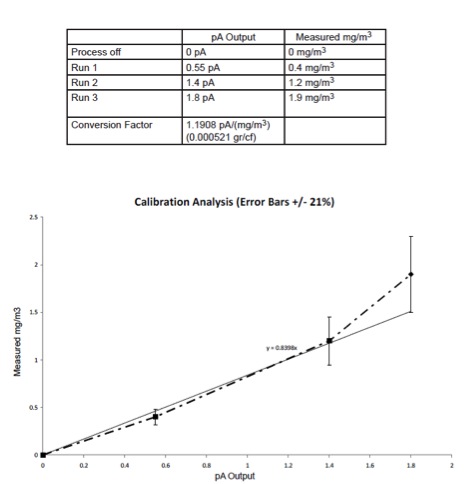
The base-line value was an average of 0.55pA with peak values between 18pA and 51pA
The corresponding actual base-line particulate concentration was 0.4 mg / m3 (0.000175 gr/cf).
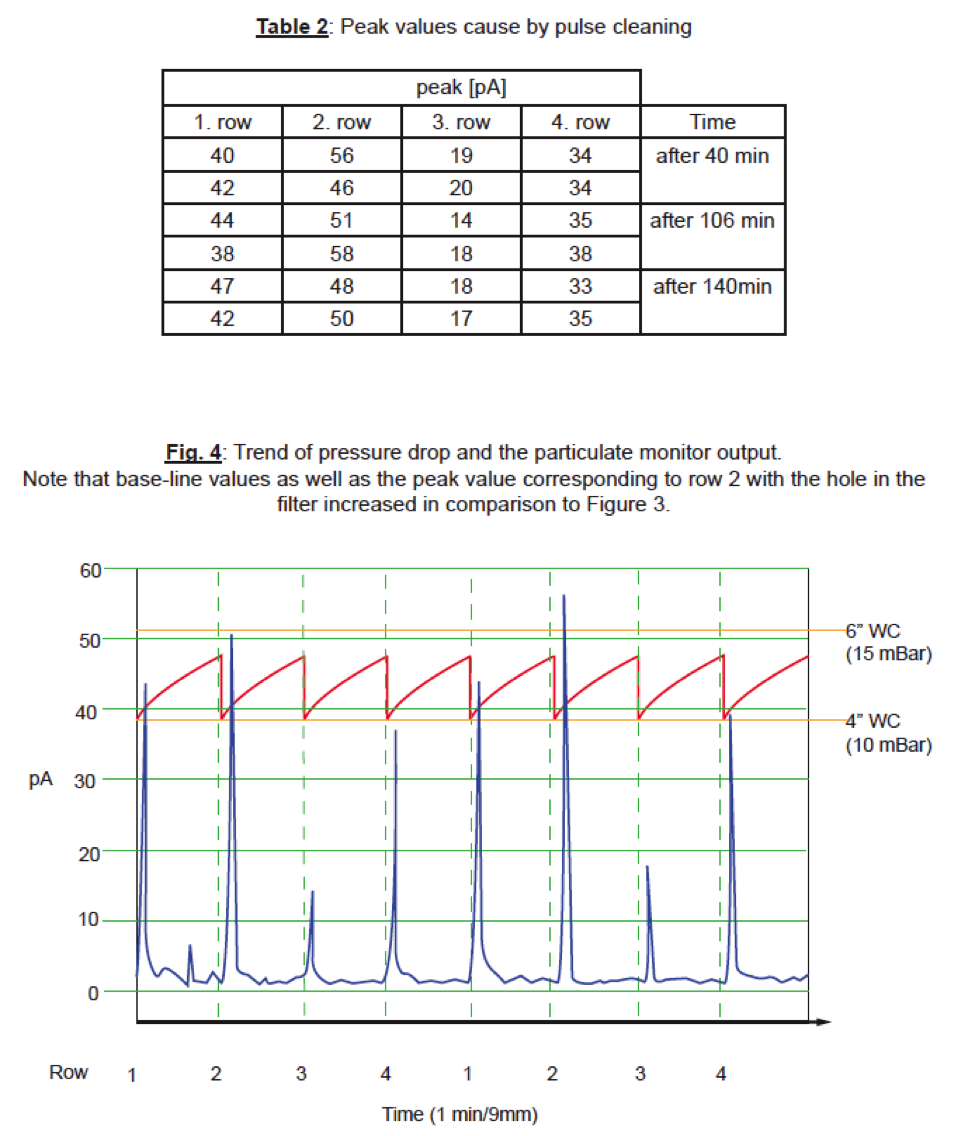
3.2 Tests with 2mm hole in one filter
The base-line value increased to an average of 1.4pA with peak values between 17pA and 58pA
The corresponding actual base-line particulate concentration was 1.2 mg / m3 (0.000524 gr/cf).
3.3 Tests with 4mm hole in one filter
The base-line value increased further to an average of 1.8 pA with peak values between 16pA and
93pA. The actual base-line particulate concentration was 1.9 mg/m3 (0.000831 gr/cf).
3.4 Correlation Analysis
4.0 Summary Conclusions
· The monitor was able to resolve baseline particulate concentrations below 1 mg/m3.
· The monitor was able to detect very small leaks of increasing size.
· Basic correlation tests confirmed instrument reasonably linear to actual mass.